Distribution maps
What is a distribution map
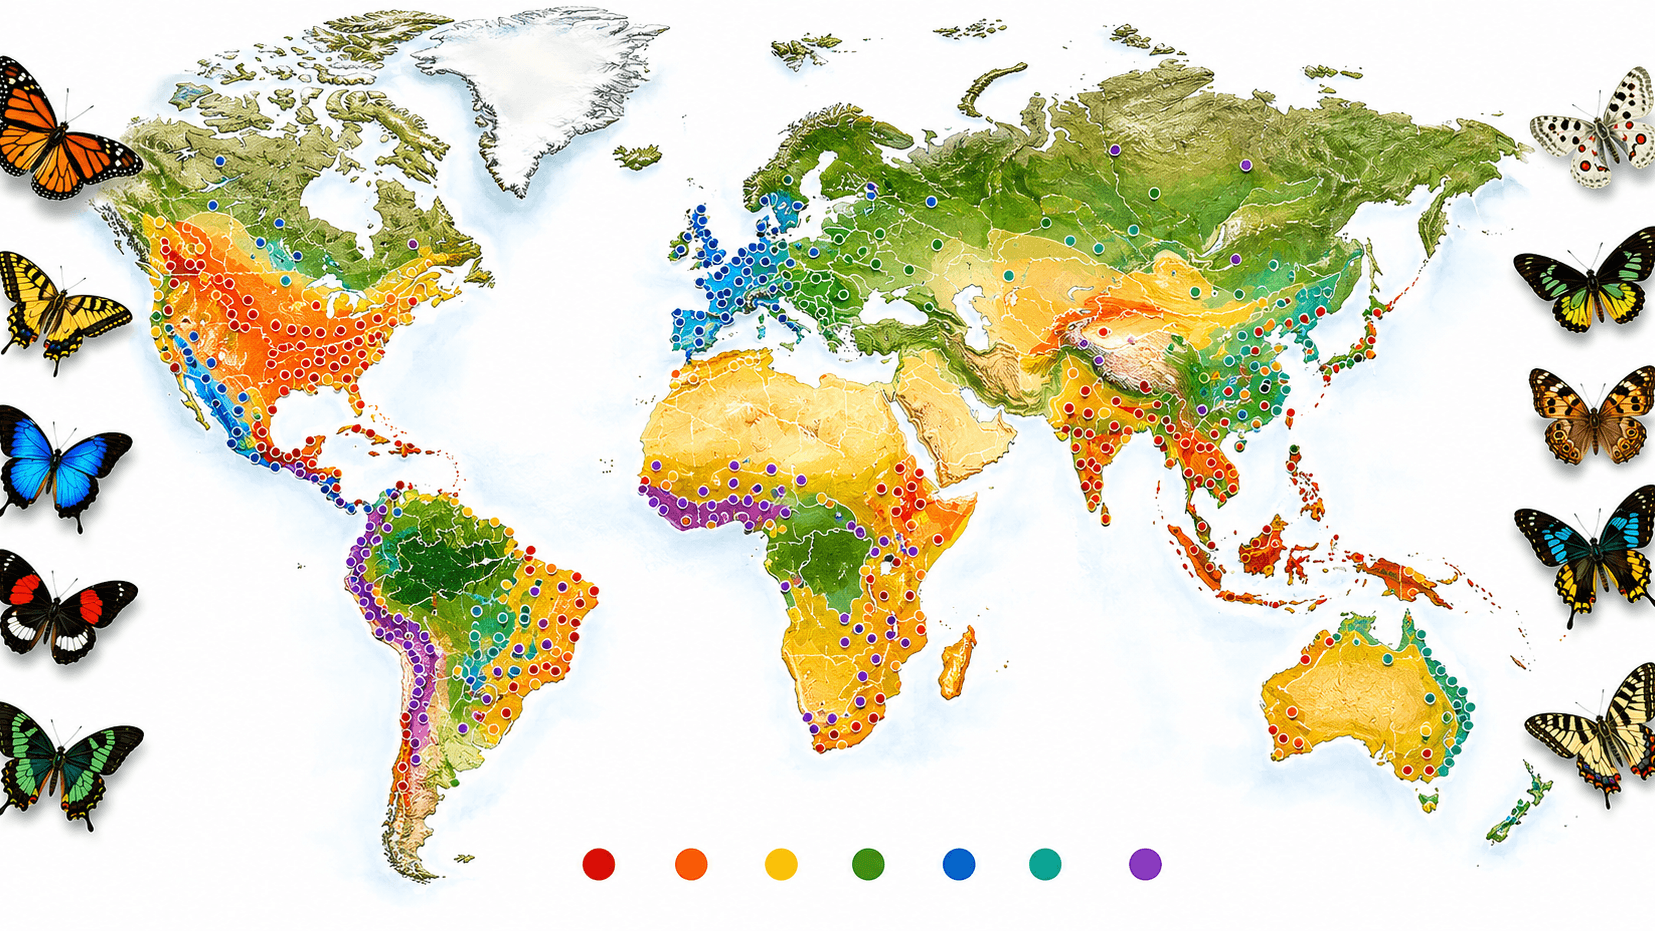
A distribution map (range map) is a geographic image showing where a given butterfly species lives. It marks territories where the species has been found with a certain regularity, confirmed by observations.
A range map answers the question: can I encounter this species in my region? — but does not guarantee an encounter at a specific point, because within the range the species is unevenly distributed.
What a range map shows
Three types of zones
Modern range maps usually distinguish several zones:
Permanent range — territory where the species occurs annually, breeds, and overwinters (as egg, caterpillar, pupa, or imago). This is the "core" of distribution.
Zone of regular vagrancy — territory where the species regularly arrives in summer, sometimes forming temporary breeding populations, but does not overwinter reliably. A typical example for Russia is the Red Admiral (Vanessa atalanta) and Painted Lady (Vanessa cardui): their permanent range is southern Europe and North Africa, but each summer they reach Scandinavia and Siberia.
Historical range — territory where the species occurred previously but is now absent or extremely rare due to habitat change.
What a map does not show
A range map does not show population density: a species may be common in one part of the range and extremely rare in another. Brimstone (Gonepteryx rhamni) occurs across the European part of Russia, but its abundance in the Moscow region and Karelia differs by orders of magnitude.
A map does not show habitat: a species with a wide range is tied to specific stations. Apollo (Parnassius apollo) is listed across the Urals range, but in reality occurs only on dry rocky slopes with stonecrop — not everywhere within the range.
Data sources for maps
Butterfly range maps are built from several types of data:
Collection data
Historically the main source — specimen labels in museum collections. Each stored specimen has a label with collection locality and date. Data from thousands of collections are combined in GBIF (Global Biodiversity Information Facility) and regional databases.
Limitation: historical collecting is uneven — rich regions (Western Europe, selected areas of Russia) are well studied, inaccessible territories (Yakutia, Tian Shan mountains) less so.
Field observations (citizen science)
Since the 2000s the main data source is volunteer observations uploaded to iNaturalist, GBIF-Observation.org, Butterfly Conservation Europe, and national portals.
By 2026 iNaturalist contained tens of millions of butterfly observations worldwide — the largest field database in the history of biology. Each observation includes GPS coordinates, date, and photo, allowing range maps to be built with resolution down to a few kilometres.
Transects and systematic monitoring
In Europe the European Butterfly Monitoring Scheme (eBMS) operates: volunteers regularly (weekly) walk fixed routes and count all butterflies encountered. This allows tracking not only range but changes in abundance over time.
In Russia a similar system is only forming; observer data concentrate on iNaturalist and "Fauna of Russia".
Factors determining range
Climate
Temperature and humidity are the main limits. The northern boundary of most warmth-loving species is determined by mean summer temperature: the caterpillar must complete several instars within the season. The southern boundary is often linked to heat and drought: moisture-loving species do not tolerate Mediterranean summer.
Climate change shifts ranges northward and upward in mountains. In Europe over the last 30 years several species have expanded their range north by 50–200 km. Some species have begun breeding regularly in Britain and Scandinavia, where they were previously rare vagrants.
Larval food plants
A butterfly's range cannot be wider than the range of its caterpillar food plant. Brimstone feeds only on buckthorn (Frangula alnus and Rhamnus catharticus) — its range coincides with buckthorn's range. Apollo is tied to stonecrop (Sedum) — occurs only where the food plant grows.
Habitat
A species with a wide climatic range may still be rare due to habitat requirements. Large Blue (Phengaris arion) requires the simultaneous presence of thyme and a specific ant species (Myrmica sabuleti). Without ants — no butterfly, even if the climate is suitable.
Dispersal and barriers
Mountain ranges, large rivers, seas — barriers to spread. Several species do not cross the Alps or the Ural Mountains: on one side the species exists, on the other — not. Islands have endemics precisely because the sea barrier isolated populations.
Some species, conversely, are strong migrants: Painted Lady crosses the Sahara, monarch — the Atlantic (in rare cases). Their ranges on maps are enormous.
How to use maps in the atlas
Checking likelihood of encounter
If you encounter an unfamiliar butterfly and identify a probable species — check the map: does your region fall within the range? If not — either the identification is wrong, or it is a vagrant specimen, or the find requires documentation as a new record.
Planning observations
Maps help plan trips: where to look for a specific species, in which region species richness is greatest. Atlas regional sections — Russia, Europe, Asia, Africa, North America, South America, Australia and Oceania — give an overview of each region's fauna with the best sites and seasons.
Interpreting boundaries
Range boundaries on a map are not walls but probability zones. An encounter beyond the official range boundary is not an error but a potential scientific record. Upload it to iNaturalist: citizen science data directly update range maps in GBIF.
Dynamic ranges
Butterfly ranges are not static — they change within one observer's lifetime.
Expanding ranges: in Russia over the last 20 years several species have moved steadily north — Red Admiral (Vanessa atalanta) now breeds regularly in the Moscow region; several blue species have expanded their northern boundary in Finland.
Contracting ranges: Apollo (Parnassius apollo) has lost most of its western European populations; several wetland species have disappeared from drained areas.
Fluctuations: in good years Painted Lady and Red Admiral penetrate far north of usual; in poor years the picture is reversed. A map shows the "average" state, not a specific year.
Accuracy and data limitations
Range maps are most accurate where there are more observers. Western Europe has the best coverage; Siberia and Central Asia have significant blank spots. In remote areas a range map reflects not actual distribution but distribution of observers.
Before using a map for serious tasks (scientific paper, protected area planning) check data currency — the range may have changed since the map was last updated.
For current point data — use GBIF (gbif.org) and iNaturalist: both platforms are updated daily by thousands of observers worldwide.